


Why Your Retail Analytics Are Looking Backwards (And What To Do About It)
.png)
More articles:
.png)
.png)
.png)







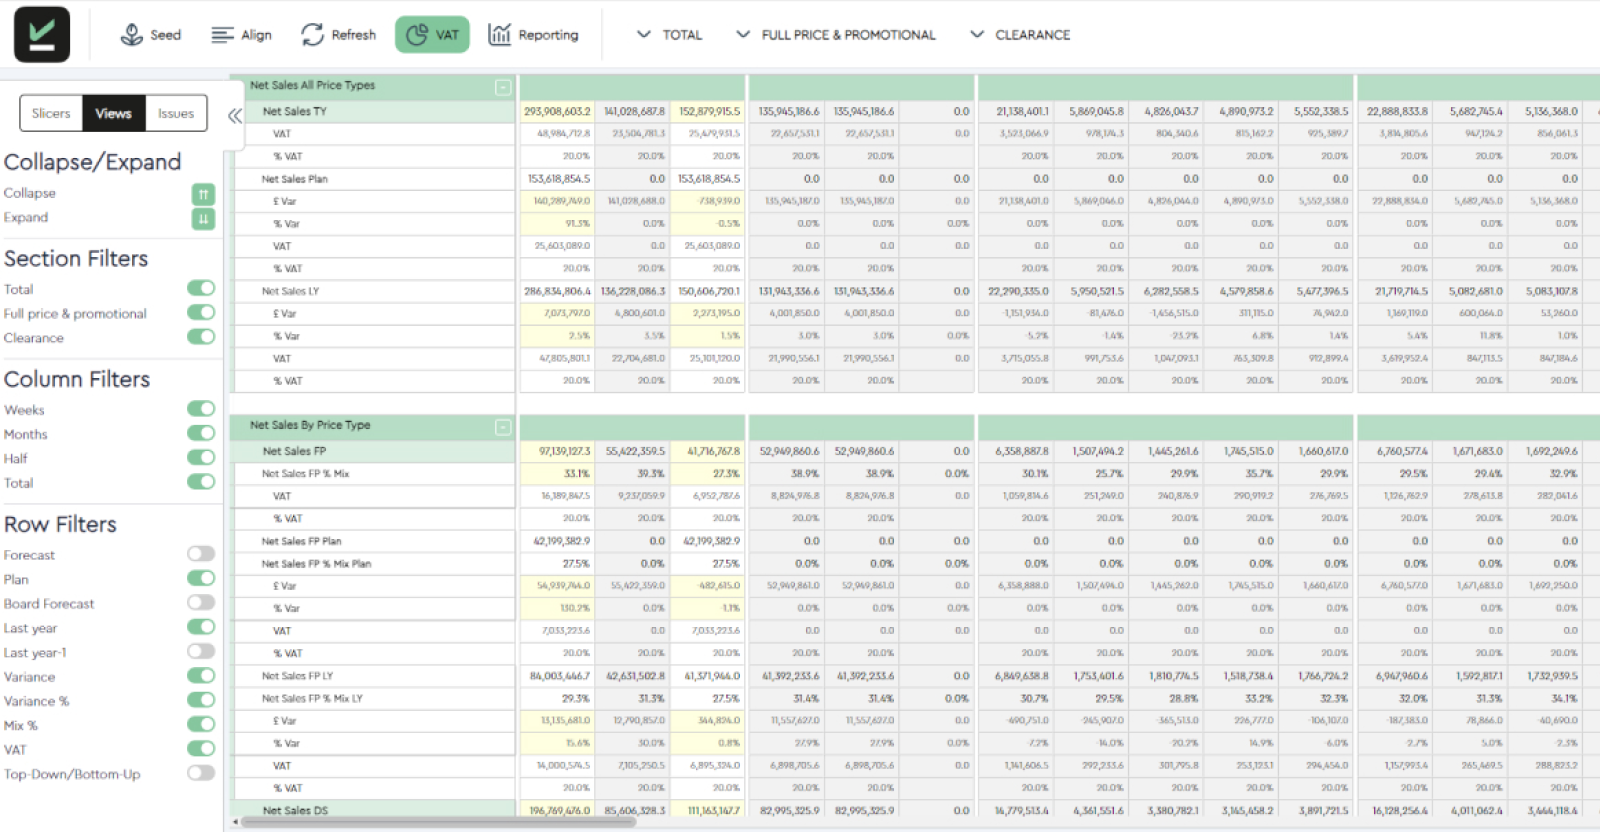

A retailer can have accurate dashboards, a full reporting pack and more data than it has ever had and still be caught out by the next month's stock, sales and margin position.
This indicates that retail analytics has focused purely on describing past results rather than supporting the decisions that shape future outcomes.
Analytics only earns its place commercially when it changes a future decision while there is still time to act on it. Everything else, however well visualised, is a record of what already happened.
This article sets out why that gap opens up even inside well-run reporting environments, and how to focus on what might happen next without throwing away the reporting that already works.
Key Takeaways
- Historic reporting is necessary, yet incomplete on its own. It outlines past performance without pointing towards the next action.
- Accurate dashboards can create false confidence when they are disconnected from forecasts, commitment and a decision owner.
- Forward visibility requires a reliable prediction combined with named accountability before trading windows close.
- A modern WSSI should complement business intelligence and reporting, not replace it.
What Does Looking Backwards Actually Mean for Retail Analytics
Retail analytics looks backwards when it restricts itself to descriptive outputs: past sales figures, remaining stock levels and delivered margins.
Descriptive and diagnostic retail data analysis explains what happened and why. These functions establish the essential baseline every retailer depends upon. However, challenges emerge when the analytical process finishes at this point. Predictive and prescriptive questions about upcoming events and necessary responses remain unanswered.
A retailer using only descriptive and diagnostic retail data analysis can be entirely correct about last week and still blind to a s tock or margin problem building three weeks out.
That’s where forward looking analytics can provide extra clarity. They build directly upon that solid descriptive foundation to shape an immediate, practical decision.
The Four Levels of Retail Analytics
Not all analytics delivers the same commercial value. Some forms of analytics help retailers understand performance after it has happened, while others help teams anticipate what is likely to happen and decide how to respond.
The difference is not the quality of the data, but the point in the decision cycle where that insight can be applied.
Retail analytics sits on a spectrum from describing the past to recommending the next action.
- Descriptive analytics answers what happened by reporting sales, stock, margin and other historical performance.
- Diagnostic analytics explains why it happened, identifying the factors behind changes in demand, availability or profitability.
- Predictive analytics estimates what is likely to happen next, using current trends, forecasts and commitments to anticipate future outcomes.
- Prescriptive analytics recommends what action should be taken, helping retailers decide how to respond before trading windows close.
Most retailers already have strong descriptive and diagnostic reporting. The commercial advantage comes from combining these foundations with predictive and prescriptive analytics so decisions can be made while there is still time to influence the outcome.
Good Dashboards Can Still Create False Confidence
Clean visualisation and accurate actuals make a reporting pack feel authoritative, and that feeling of controli s often misplaced.
Growing retailers often depend on historic reporting tools and fragmented spreadsheets. While these tools accurately track past performance, they leave out forward forecasts, open commitments, scenario impact and decision ownership.
Let’s dive into why this happens.
The report ends at the current period
Current sales, margins, and stock levels tell you where you are today, but not where you will be in the coming weeks or months. True value comes from looking ahead, while there is still time to adjust your trading strategy.
Aggregation hides where risk is forming
High level figures can look healthy while problems develop further down the hierarchy. A company, channel or category may be on target, but individual products, stores, sizes or weeks could already be underperforming.
Retail store analytics helps teams understand store performance, but it needs to be connected to product and inventory forecasts. With item level forward forecasts, planners can spot risks early instead of relying on overall results that may hide where action is needed.
Forecasts and commitments sit outside the dashboard
Sales forecasts, stock, intake, purchase orders, OTB and promotion assumptions often live in separate tools or spreadsheets from the reporting pack itself. When those pieces are not connected, a change in one area does not visibly flow through to the wider commercial position. This means that decisions get made on a partial picture.
There view cadence is slower than the decision window
A weekly or monthly reporting pack can be accurate but not timely. By the time it highlights an issue with lead times, stock cover or promotions, there may be little time left to respond.
Insight has no action owner
Highlighting a variance is not the same as assigning a decision. Without a named owner, a deadline and a recommended response attached to it, the same issue tends to reappear in the next review. This is because the insight was noticed but never converted into accountable action.
The Backward-Looking Analytics Diagnostic
The symptoms of backward-looking analytics are often visible long before they impact trading performance. Reporting may be accurate, widely used and trusted, while still leaving important commercial questions unanswered.
Use the diagnostic below to assess whether your current analytics environment is helping shape future outcomes or simply reporting on completed performance. Each area highlights a common limitation that can prevent teams from identifying risks, evaluating options and taking action while there is still time.
Which Questions Should Forward Looking Retail Analytics Answer?
A forward-looking view should cover likely demand, future stock cover, availability risk, excess stock exposure, intake timing, OTB pressure, where a forecast is diverging from plan, and which actions are still available before the outcome is locked in.
Use the checklist below to test whether a current dashboard or reporting pack actually answers them.
- What is likely to happen, not just what has already happened?
- When does the risk become commercially material?
- Which products, stores or channels are driving it?
- Which commitments, such as intake or OTB, are still changeable?
- Who owns the decision, and by when do they need to make it?
- What action is actually recommended, not just what number has moved?
What Data Needs to Be Connected to Create a Forward View?
A useful forward view connects actual sales and stock with forecasts, intake, purchase orders, lead times, OTB, promotions, product hierarchies and channel assumptions.
But more data doesn’t always mean better decisions. Data only creates value when it helps someone make a specific decision and take action, rather than simply adding another number to an already crowded report.
It’s Time to Move from Reporting to Forward Decision Support
Moving beyond backward-looking reporting does not require replacing existing dashboards or creating more data outputs. The shift comes from changing how analytics is used: connecting information to decisions, identifying risks early enough to act, and making accountability part of the process.
Five steps make that transition practical rather than theoretical:
- Define the decisions and the horizon they need: name the specific stock, intake or margin decisions that matter and how far ahead each one needs to be seen.
- Connect actuals with forecasts and commitments: bring sales, stock, intake, OTB and promotion assumptions into one view instead of separate files.
- Prioritise exceptions: surface the risks with the greatest commercial impact and the least time remaining, rather than treating every KPI equally.
- Add scenarios and owners: make assumptions visible, allow them to be tested, and assign a named owner to each material risk.
- Measure whether insight leads to timely action: track whether flagged risks are actually resolved before the commercial window closes, not just whether they were reported.
This doesn’t mean retailers should replace their BI tools. Business intelligence and reporting remain essential for trusted actuals, trend analysis and performance reviews, and nothing in this argument suggests removing that layer. What is usually missing is not more reporting but a planning environment that takes those trusted inputs and turns them into an owned, forward-looking view, one where a forecast, a commitment and a decision date sit next to the historic numbers rather than in a separate file.
Where a Modern WSSI Sits in the Picture
A WSSI is the forward planning layer that sits alongside business intelligence and reporting rather than competing with it. Why a modern WSSI still matters is that it holds top down and bottom-up forecasts together, tracks forecast KPIs in real time and rolls up or drills down across merchandise hierarchy and channel as trading develops.
Scenarios and exceptions surface the decisions that matter most, while the underlying actuals and trend analysis still come from existing BI and ERP systems.
PlanIT Retail's published customer examples describe centralised forward stock visibility, connected forecasts and the ability to see opportunities and risks earlier thana standard reporting cycle would allow.
See How a Connected Forward View Works
The value of retail analytics is measured by the commercial decisions it changes, not the number of reports it produces.
Historic reporting identifies what went wrong. A genuine forward view shows what is developing now, which commitments are still adjustable, and who needs to act and when. That combination is what moves a retailer from reactive to proactive.
Contact PlanIT Retail to see how actuals, forecasts and future stock positions can be brought into a forward view of sales and stock, helping teams identify risks and opportunities with enough time to act.
Frequently Asked Questions
What are retail analytics?
Retail analytics is the use of sales, stock, margin and customer data to understand and improve retail performance. It spans descriptive retail data analysis of what happened, diagnostic analysis of why, and predictive and prescriptive analysis of what is likely to happen next and what to do about it.
What is the difference between retail analytics and retail business intelligence?
Business intelligence and reporting typically focus on presenting trusted actuals, trends and performance dashboards, often built around retail store analytics and category level reporting. Retail analytics is the broader discipline, which includes BI as its descriptive foundation but also covers predictive and prescriptive work aimed at future decisions.
Why are dashboards often backward looking?
Most dashboards are built to report actuals accurately against a fixed reporting cycle. Without a connected forecast, visible commitments and a named decision owner, even a well-designed dashboard ends up confirming what already happened rather than supporting a decision that still has time to change the outcome.
What are predictive retail analytics?
Predictive retail analytics uses historic patterns, current trends and planning assumptions to estimate what is likely to happen next, such as future demand, stock cover or margin exposure, so a decision can be made before the outcome is fixed.
What data is needed for forward retail planning?
At minimum, connected actual sales and stock, a live forecast, intake and purchase order commitments, OTB position, promotion assumptions and enough product hierarchy and channel detail to see where a risk is concentrated rather than only at a total level.
Can a WSSI work alongside existing BI and ERP systems?
Yes. A WSSI is a planning layer, not a replacement for BI or ERP. It typically draws actuals from those systems and adds the connected forecasting, scenario and exception capability that a standard reporting environment does not provide on its own.


Contact Us
If you’d like to request a demo or find out more about the products and services we offer, we’d love to hear from you. Leave your details in the form below and we’ll get back to you.