


How Mature Is Your Retail Demand Forecasting? A Practical Self-Assessment for Mid-Market Retailers

More articles:











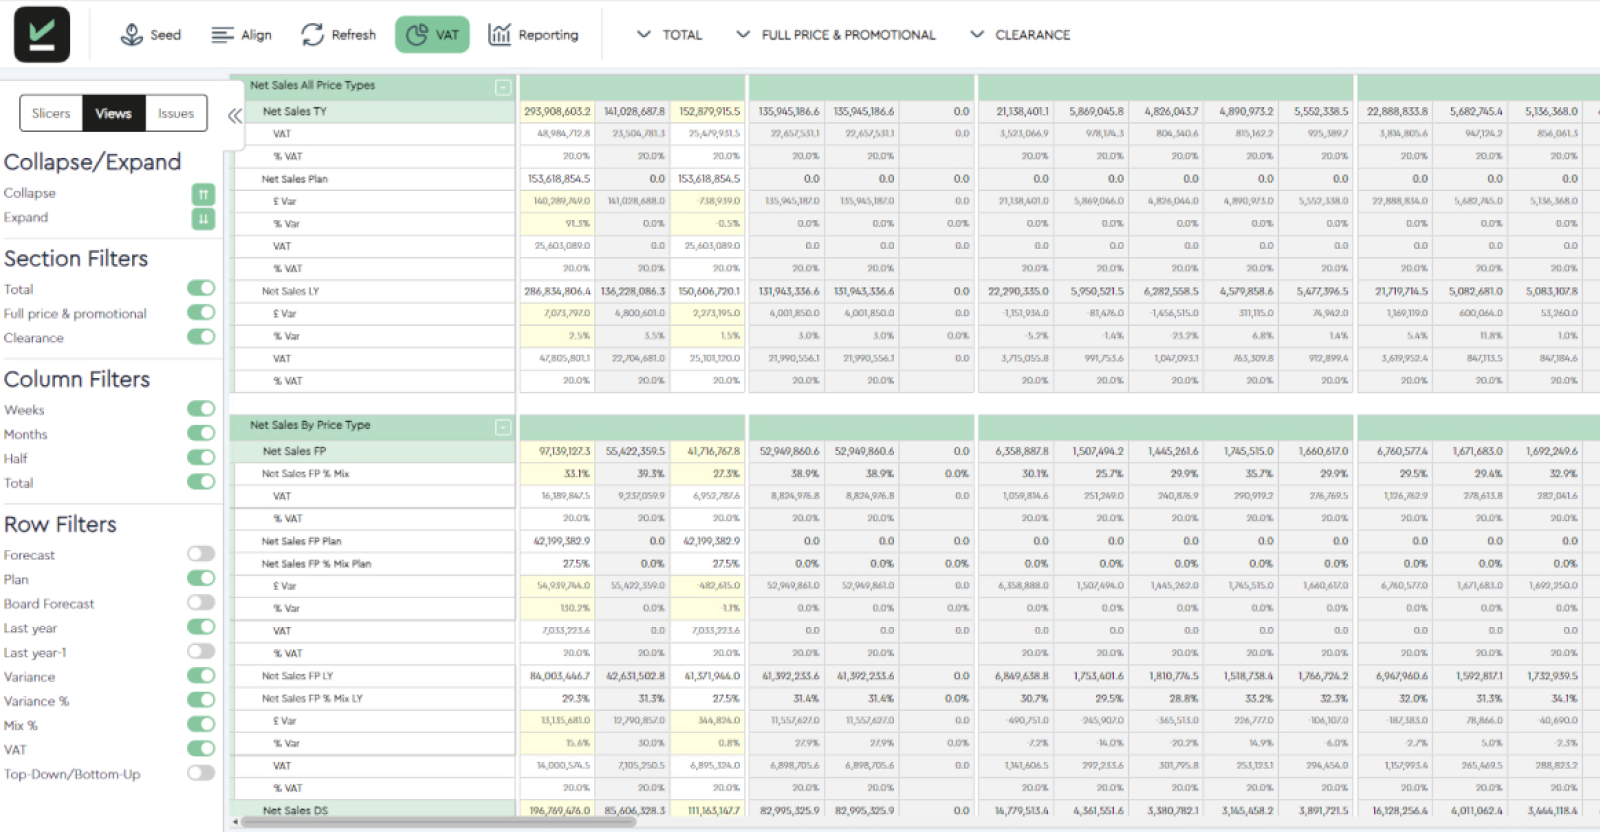
Plenty of retailers already have an algorithm that produces a forecast every week. However, few can honestly say that the number is trusted, repeatable and fast enough to act on.
That gap between forecast and accurate insight is what retail demand forecasting maturity measures: can you trust the inputs behind the forecast, does the team follow the same process every cycle, do commercial and merchandising assumptions actually line up, can anyone explain why the number changed, and can the business act on a shifting demand signal before the trading window closes?
The self-assessment contained in this guide gives mid-sized retailers a practical way to score that capability, built from real retail planning practice.
It is not a retail planning benchmark or a retail forecasting survey. Treat it as an internal diagnostic, a structured conversation across commercial, merchandising, finance, and planning, more useful with four or five people in the room than filled in solo at one desk.
Key Takeaways
- Score five dimensions from 1 to 4: data readiness, process consistency, cross-functional alignment, forecast explainability and response speed.
- Add the scores together for a total between 5 and 20, mapped to four levels: Reactive, Developing, Controlled or Forward looking.
- Score current, repeatable behaviour backed by evidence. Save the future ambition for the action plan.
- A high score signals a controlled process. Forecast accuracy is a related measure worth tracking alongside it, not a given.
What Does Mature Retail Demand Forecasting Look Like?
Most retailers already produce a forecast, whether from a spreadsheet, an ERP module or a dedicated planning tool. Having one was never really the hard part.
Forecasting maturity comes from producing a forecast that is trustworthy and fast enough to act on. It should genuinely drive retail inventory management, from OTB and intake through to allocation and trading decisions, every planning cycle.
Too many forecasts still get reconciled, argued over or overridden after the fact, when they should be trusted on sight.
A capability is mature when it survives a personnel change, holds up when challenged, and turns a demand shift into a decision while there's still time to act on it. That's a different bar to whether last month's number happened to land close to actual sales.
How Should You Use This Forecasting Maturity Self-Assessment?
Instead of filling this out solo at your desk, gather the key decision-makers who buy, plan, and manage commercial performance.
Score each capability from 1 to 4 based strictly on current, repeatable behaviour rather than future ambition or planned tools.
Before locking in a score, gather evidence such as:
- Who owns each data source
- What the planning calendar says versus what happens in practice
- A recent forecast override and whether anyone could explain it
- A recent demand change and how long it took to influence a planning decision
A score without evidence usually reflects how the team would like to operate, not how it operates today.
Which Five Capabilities Determine Forecasting Maturity?
These five capabilities lean heavily on each other. A weakness in one limits what the others can achieve, so evaluate each dimension on its own merits.
1. Data Readiness
Data readiness comes down to whether your forecasting inputs (sales, stock, intake, product hierarchies, channels, promotions, and events) are timely, complete, reconciled, and granular enough to support decisions.
When data readiness is weak, teams fall into a trap of late manual extracts, conflicting system versions, and gaps in history that force planners to patch around missing information during every single cycle.
A team scoring a 1 routinely starts forecasts from manual, unreconciled extracts. To reach a 4, you must have a single validated dataset with named owners for every source.
Priority: Define your minimum forecasting dataset, assign clear data ownership, and establish repeatable validation rules before attempting to automate unreliable data.
2. Process Consistency
Process consistency measures whether your forecast is produced on the same schedule, at the same granularity, and using the same baseline logic, regardless of who is running the cycle.
Without consistency, planning becomes dangerously fragile and dependent on one or two key individuals. When they are away, the cycle slips or gets rebuilt from scratch.
Moving from ad hoc updates to a high score requires a documented planning calendar, defined decision rights, version histories, and regular forecast-versus-actual reviews.
That fragility is exactly why a modern WSSI still matters: a shared, structured planning tool turns a personal habit into a process that survives a personnel change.
Priority: Standardise the forecasting cycle, decision rights, and team handoffs before attempting to increase cycle frequency.
3. Cross-Functional Alignment
Alignment means commercial, merchandising, buying, finance, supply chain, e-commerce, and marketing teams operate from the exact same assumptions.
The classic sign of poor alignment is having two or three different numbers circulating for the same period, each defended by a different team, with disagreements surfacing only after inventory commitments are locked in. Mature organisations reconcile top-down commercial targets against bottom-up item forecasts early. They maintain an agreed log of assumptions, host routine reconciliation meetings, and follow clear escalation rules to resolve material gaps.
Priority: Build a shared assumptions log and establish a clear escalation path for resolving material gaps between teams.
4. Forecast Explainability
Explainability is all about visible logic. Anyone reviewing a number should be able to understand its underlying drivers and baked-in assumptions. This doesn’t have to mean a detailed explanation of the calculation logic for every single number; data visualisation against key benchmarks, and a digestible explainer of forecast algorithm logic are usually enough to foster confidence in forecasts.
The common weakness here is the "black box" output or hidden spreadsheet. This is a situation where numbers shift without an obvious reason why.
Achieving maturity doesn’t require everyone to understand complex statistical modelling, but it does require transparency. Manual changes should be clearly highlighted without losing visibility of underlying plans and system forecasts.
Priority: Make assumptions and manual overrides visible by default, with clear ownership of each forecast level.
5. Response Speed
Response speed measures how quickly a changed demand signal turns into a tangible decision regarding retail inventory management, intake, open-to-buy (OTB), allocation, replenishment, promotions, or markdowns.
Updating a report faster doesn’t count on its own. Teams often spend so much time gathering and reconciling data that by the time they act, the commercial window has closed.
A mature process spots shifts at the item level before they show up in category totals, prioritises exception flags and assigns clear owners to each alert, with a clearly defined business process for evaluating the results of interventions. This is where item level demand planning that flags exceptions early earns its keep.
Priority: Cut out administrative data prep, prioritise item-level exceptions, and define the action each alert should trigger.
What Does Your Forecasting Maturity Score Mean?
Add your five-dimension scores together for a total between 5 and 20. Treat the bands below as a practical internal guide for prioritising action: an internal marker, not an external market benchmark or a claim about forecast accuracy.
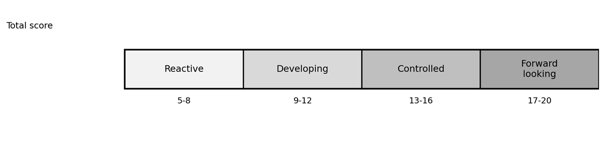
Add your five scores together and place the total on the scale.
- 5 to 8: Reactive
- 9 to 12: Developing
- 13 to 16: Controlled
- 17 to 20: Forward looking
Score Interpretation
How Should You Prioritise the Gaps the Assessment Reveals?
Not every gap deserves equal attention. Start with the weakest dimension blocking progress elsewhere: the five capabilities lean on each other more than a flat scorecard suggests.
- Data readiness should come before adding automation, since a faster cycle on unreliable data just produces quicker bad decisions.
- Process ownership should come before increasing frequency, since a planning cycle that nobody consistently owns will not become more effective through repetition.
- Explainability should come before wider AI adoption, since a team won't trust a number it can't interrogate.
These dependencies echo what PlanIT Retail hears directly from growing retailers: a consistent theme around visibility and control in retail planning, fragmented spreadsheets, and confidence that rests more on process than on any single tool.
What Should Retailers Improve at Each Maturity Level?
Across the retail planning space, our extensive experience has gleaned some universal benefits that can be utilised no matter your maturity level:
- Reactive teams get the most value from fixing data readiness first. This means naming an owner for each core dataset and removing the manual reconciliation that happens before every cycle.
- Developing teams typically need process consistency next: a documented planning calendar and an override process with reasons captured, so the cycle survives a personnel change.
- Controlled teams tend to find the biggest opportunity in cross-functional alignment and explainability: a shared assumptions log and visible driver and override logic, so trust extends beyond the planning team.
- Forward-looking teams are usually ready to push on response speed: tighter exception prioritisation, scenario testing and a closed-loop review that checks whether the action taken worked.
Where Can Retail Planning Technology Support Maturity?
Technology cannot replace clear ownership, reliable data, or defined decision rights. However, the right planning software removes the administrative friction that traps teams in reactive modes.
A central forward view of forecasts that brings sales, stock, and intake together replaces manual spreadsheet patchworks. Configurable KPIs and multi-level forecasts make overrides and discrepancies visible alongside the system forecast and plan, as part of the normal workflow. Furthermore, exception dashboards and scenario testing give teams early warnings with assigned owners and clear actions.
Solutions like PlanIT Retail's WSSI and Line Card are built around this kind of centralised forecasting and inventory visibility. While tools do not replace discipline, they provide the structure needed to keep processes controlled and forward-looking.
Where This Leaves You
A high score on this assessment doesn't guarantee accurate forecasts, and a low score isn't a verdict on the team running the process either. What it does give you is a practical, evidence-based way to see which of the five capabilities is currently holding the others back, and where a focused improvement would have the greatest impact.
Retailers that treat forecasting as a capability to build deliberately tend to make that progress faster.
Turn The Assessment into an Improvement Plan
A forecasting maturity assessment earns its keep when it leads to a focused improvement plan, not a scorecard filed away and forgotten.
If data readiness or process consistency is what's holding your team back, contact PlanIT Retail today to explore how centralised forecasts, consistent ways of working and action-focused planning views can support a more controlled, forward-looking planning process.
Frequently Asked Questions
What is retail demand forecasting maturity?
Retail demand forecasting maturity is how reliably a retailer's forecasting process turns data and commercial judgement into forecasts the business can trust and act on, covering data readiness, process consistency, cross-functional alignment, explainability and response speed.
How is forecasting maturity different from retail forecasting accuracy?
Forecast accuracy measures how close a forecast came to what actually happened, usually with a metric like MAPE or bias. Forecasting maturity measures whether the process behind it is repeatable, trusted and fast enough to act on. A mature process makes accurate forecasting more likely. One accurate forecast still doesn't prove the process is mature.
What is a good retail demand forecasting process?
A good process has reliable, reconciled data behind it, a cadence and baseline method that survives a personnel change, shared assumptions across commercial and merchandising teams, trusted logic behind each forecast, and a way to turn a changed demand signal into a decision before the commercial window closes.
How often should a retailer reassess forecasting maturity?
Every six to twelve months is usually enough to track meaningful change, or after a significant shift such as a new planning tool or a material change in channel mix. Reassessing more often rarely reflects genuine process change, since maturity tends to shift gradually.
How is a maturity self-assessment different from a retail forecasting survey?
A retail forecasting survey gathers responses across many retailers to describe a market-wide pattern. This is an internal self-assessment: one retailer scoring its own process against a defined model to set its own priorities. It doesn't represent the wider market, and it's no substitute for external benchmark data.
Can a retailer improve demand planning without replacing its ERP?
Yes. Most of the gaps this assessment surfaces: unclear data ownership, inconsistent process, misaligned assumptions, unexplained overrides, slow response to exceptions, come down to process and ownership, not ERP limitations. A planning layer that sits above the ERP can address many of them directly.
What should retailers look for from planning and forecasting tools?
The best planning solutions directly address the most important gaps without forcing retailers to follow a rigid process. Planning tools should automate data reconciliation, provide reliable forecast guidance, facilitate reconciliation of multi-level forecasts, and highlight exceptions and variances, while remaining flexible enough to respond to changes to business processes and forecasting cycles. Forecasting tools should facilitate robust business processes, not dictate them.


Contact Us
If you’d like to request a demo or find out more about the products and services we offer, we’d love to hear from you. Leave your details in the form below and we’ll get back to you.